What’s up Graham, it’s guys here :-)
After a break, the newsletter is starting up again! Looking forward to bringing you some interesting content...
From the 1950s to the mid-2000s, homeownership was seen as the ultimate financial goal. The housing market was booming, and everyone believed owning a house was the key to becoming wealthy. It was the American Dream.
But by 2008, the housing market faced one of its most significant downturns in American history. Home prices began to decline in early 2006, and the situation worsened shortly when the Federal Reserve started to raise interest rates. Many borrowers could not repay their mortgages, which led the subprime lenders to file for bankruptcy.
This crisis peaked in September 2008 when Lehman Brothers, one of the largest investment banks in the U.S., declared bankruptcy.
As real estate prices started to fall, refinancing or selling their homes was not an option, leading to nearly 4 million foreclosures in the U.S. between 2007 and 2010.
Fast-forward to today, and the housing market faces an affordability crisis, where only the wealthy can afford the homes they want. A recent study found that 90% of millennial homeowners regret their first home purchase.
Despite record-high values, constant price increases, and the worst affordability in 40 years, there’s some good news — a few major housing markets are finally beginning to fall.
For example, the Manhattan housing market just dropped 3% thanks to rising inventory. Florida and Texas are starting to witness price reductions with more available homes than there are buyers, and twenty-four of the largest 150 metros are already seeing year-over-year declines.
This is why, in this week’s newsletter, we are going to break down exactly where home prices are falling the most across the United States, why we could soon start to see the median price come down, and, most importantly, what you can do to come out ahead.
The Impact of Seasonality
It’s important to understand the term “seasonality.” Real estate follows a predictable, cyclical pattern of peaks and valleys, where prices rise and fall consistently.
Historically, people are most likely to buy a home and move around Spring and Summer, and sellers are most likely to take their homes off the market in the winter. This leads to a mid-year increase in demand for homes that drives prices even higher.
Redfin analysts say that this is mainly dictated by weather. Cold and wintry conditions can make it hazardous or simply undesirable for buyers to travel to tours, and sellers know that homes have more curb appeal when flowers are in bloom, and lawns are lush.
Most seasonal pricing tends to be a difference of 8-12% off the sales price, but some locations, like the Northeast and Great Lakes, lead the nation with a variation of over 22% between summer and winter sales prices.
National Association of Realtors said that sales activity between February and March typically increases by 34% while prices rise by 3%, and the busiest months tend to occur in June, July, and August.
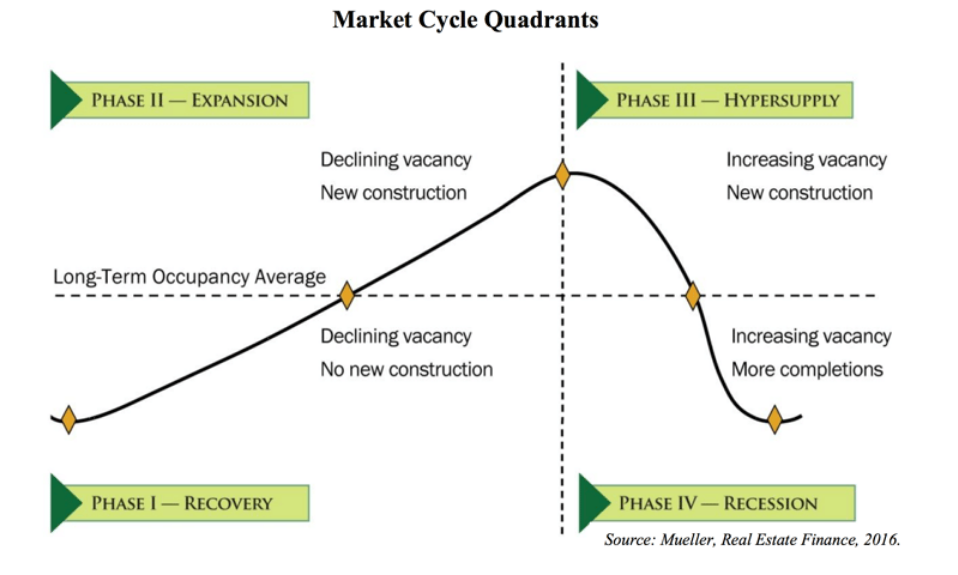
The 18-Year Cycle
The real estate market can be challenging to predict, but one method has had fairly decent accuracy dating back to the late 1800s: The 18-Year Cycle. This was identified by the British Real Estate Economist Fred Harrison, who correctly predicted the housing market crashes in the early 1990s and 2008. His next “housing crash” is expected to occur in 2026.
According to Fred Harrison, each 18-year cycle consists of 4 phases --
Phase 1: Recovery
Each 18-year cycle consists of a 14-year expansion during which real estate prices rise, followed by a subsequent 4 years of falling prices. This cycle begins once the market starts recovering from a crash. During this time, demand is low, the market is uncertain, banks aren’t lending much money, and new constructions somewhat stall.
Phase 2: Expansion
In the next phase, demand begins to pick up, rents begin to increase as inventory slowly gets bought, and construction picks up to satisfy the extra demand.
Phase 3: Hyper Supply
In the third phase, the market starts to get overheated, prices rise at an unprecedented rate, and more inventory begins to flood the market. Some call this The Winners Curse as new people buy in, expecting profits to continue.
Phase 4: Recession
In the fourth phase, demand begins to fizzle out, overbuilding causes prices to drop, banks scale back lending, buyers wait because they believe prices will continue falling, and sellers reduce their asking prices.
Remember that this is over-simplified, and aspects like regional variability, policy changes, and market sentiment could shorten or lengthen these timeframes depending on the area. But if he’s right, our next “downturn” could only be another two years away.
Where are Prices Falling Prices Today?
Currently, two states are leading the way in falling prices — Florida and Texas. Both states have been building more homes than any other part of the US to make room for pandemic-era newcomers. The states that saw the largest pandemic boom also saw the most development, price growth, and oversaturation. So, now, there’s not the same appeal—it’s no longer the most cost-effective, and there’s more demand than supply.
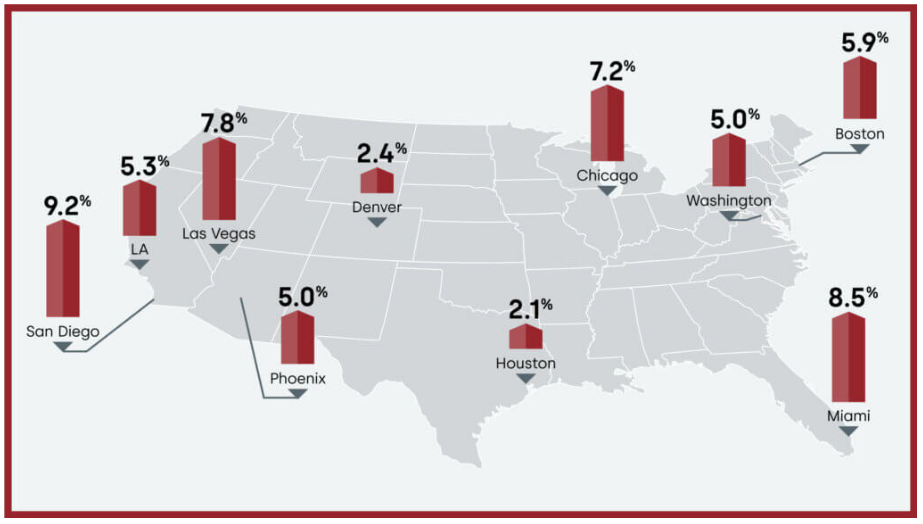
Realtor.com reported on the “Top 11 Markets” that are starting to see some of the most significant declines. At the top of the list, we have Miami with an 11.2% drop year over year, Denver with a 6.3% drop, Seattle at 5.5%, Kansas City at 4.9%, Oklahoma City at 4.3%, and San Jose at 4%.
Manhattan real estate prices are also beginning to turn the corner, with the average sales price falling 3% thanks to rising inventory. There are now 9.8 months' worth of supply listed for sale in Manhattan, meaning they’re officially in a “buyer’s market.”
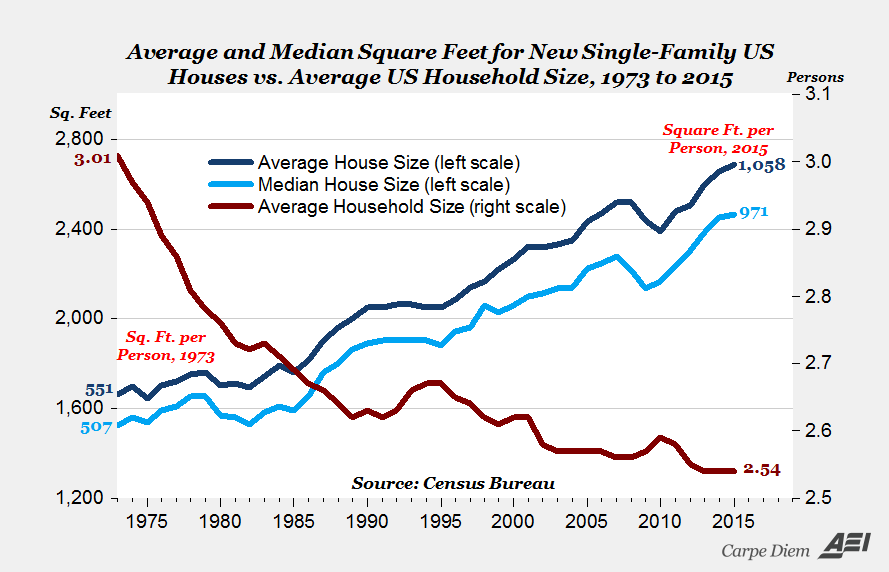
The Impact of Shrinkflation
Another slightly more sinister aspect to consider is Shrinkflation. The same term that usually refers to foods and products suspiciously getting smaller over time while remaining the same price has now officially entered the housing market.
Over time, the size of the average home has increased significantly. In the 1970s, the average household size was three people, who lived in a house that was roughly 1650 square feet. But over time, houses just continued getting bigger and bigger while the average household size got smaller. Fewer people lived in way more square footage than before.
Even though the average price per square foot stayed the same, adjusted for inflation, housing prices continued rising because houses got larger.
This is primarily because of two factors --
- Builders want to maximize the square footage on vacant land for resale value, so they’ll construct the maximum they can.
- Buyers today want extra space for activities, especially as it becomes more common to work from home.
However, this is starting to change.
Because construction costs are increasing and buyer affordability is declining, builders have begun to create smaller homes that cost less. Single-family homes have decreased in size to the lowest levels since 2010, and builders are beginning to focus on constructing more starter homes. Zillow reported a 9.5% increase in single-family homes with fewer than three bedrooms.
In my opinion, if more homeowners and builders are honest with themselves, you probably need less square footage than you think. Dining rooms frequently collect dust. Living and kitchens can often be combined in an open floor plan. And if you’re looking to optimize rather than attract the highest resale, most homes could have a more cohesive design.
Of course, I don’t say this to defend home builders. The extra square footage that you don’t actively use gets expensive. That is why you pay higher property taxes, insurance, and utility bills. So, if you can go without it and save some money, all things considered, I’d say it’s worth it.
National Market Outlook
Outside of a few declining markets, national average prices have still risen 6.3% year over year. Thanks to higher building costs, existing homeowners are paying 21% more for insurance than just a few years ago, and this is unlikely to go down.
Inventory is steadily increasing from the pandemic low of 2021. Still, if mortgage rates go back down, many people worry that’ll only drive even more demand for housing, causing prices to continue rising. However, this price increase will also encourage more sellers to list their property- especially if the difference between their existing mortgage rate and the new interest rate is lower.
Most homeowners would never want to give up a 3% mortgage in favor of a 7.5% mortgage today, but they might consider selling if future mortgage rates were at 4-5%.
Future Predictions
Interestingly enough, as of now, the average mortgage rate is above 5%.
If mortgage rates eventually level off around 5.5%, swapping an old loan for a new one might be less intimidating. This might help ease up some inventory as builders continue to fill some of the demand, but ultimately, we must wait and watch.
If you’re in the market for a home, buying something you intend on keeping for at least 10 years that you can comfortably afford is probably the best option. Otherwise, there are too many risks that come with buying and selling a home in a short timeframe. Most research shows that renting is cheaper than buying throughout almost all of the United States if you only want to stay in a place for 1-7 years.
Conclusion
Don’t rush to buy a house just to buy a house. Recognize that renting makes more sense today than a few years ago, and be careful about what you lock yourself into.
In my opinion, it’s probably best to purchase a house that you intend on keeping for at least 10 years AND that you can comfortably afford. Otherwise, there are far too many risks associated with buying and selling a home in such a short timeframe. So plan accordingly.
That's it for today. I hope you enjoyed this article. Let me know your thoughts by responding to this email - I read every single comment :)
Stay safe, stay invested and I will see you next week – Graham Stephan.
113 Cherry St #92768, Seattle, WA 98104-2205
Unsubscribe · Preferences